Reproducing SPP delivery point study results
Methodology and validation across five published delivery point studies.
Why this study
SPP’s delivery point studies evaluate new and expanded load at a delivery point, and are published with the monitored facility loadings that govern the result. We reproduced five of those published studies to measure how closely SPP delivery point results can be recovered from public data alone. Each study was run blind: the case was built from SPP’s public ITP models and the published study report, and the result was graded afterward against the printed answer. The pass criterion was agreement within plus or minus 5% of SPP’s published loading.
Results
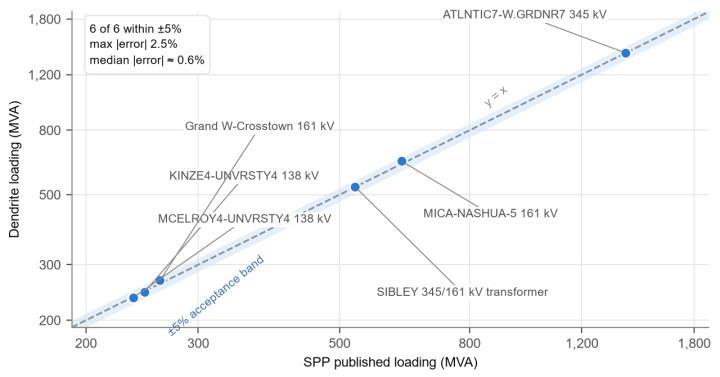
All six graded monitored elements reproduce SPP’s published loading inside the criterion. The maximum error is 2.5% and the median absolute error is approximately 0.6%. The set spans two transmission owner territories, 138 through 345 kV, five lines and one transformer, and delivery points from 50 to 1,200 MW.
| Study | Name | Utility / load / case | Monitored element | SPP pub. | Dendrite | Δ % |
|---|---|---|---|---|---|---|
| 1 | Rohan | OG&E, 300 MW, 26S | KINZE4 – UNVRSTY4 138 kV | 246.9 | 245.3 | −0.65% |
| 1 | Rohan | (same study) | MCELROY4 – UNVRSTY4 138 kV | 237.1 | 235.7 | −0.59% |
| 2 | Shale & Mica | Evergy, 1,200 MW, 34W | MICA – NASHUA-5 161 kV | 625.5 | 638.4 | +2.06% |
| 3 | Astra North | Evergy KC, 1,008 MW, 29S | ATLNTIC7 – W.GRDNR7 345 kV | 1405.3 | 1406.4 | +0.08% |
| 4 | R3 | Evergy, 975 MW, 34S | SIBLEY 345/161 kV transformer | 528.4 | 530.4 | +0.38% |
| 5 | Ink Blot | Evergy, +50 MW, 26S | Grand W – Crosstown 161 kV | 261.33 | 267.87 | +2.50% |
Loadings in MVA. Lines scored on a current basis and the SIBLEY transformer in actual MVA, following SPP’s own convention.
Method
- Case preparation. Cases prepared from SPP’s public ITP models. The delivery point is constructed per the published report, attached at an existing bus or cut in on the reported line.
- Delta method. An untouched BASE case compared against a CHANGE case carrying the delivery point load, with nothing else altered.
- Dispatch. Island-based AGC with a tiered sink injection group: host transmission owner areas first, overflow areas added only on a proven headroom shortfall, with unit MW limits enforced.
- Contingency and solve. The published contingencies applied and solved full AC, with convergence positively verified for every reported number.
- Scoring. Per SPP’s flow convention, non-transformer branches on a current basis and transformers in actual MVA, against the case’s own ratings.
- Load semantics. Taken from the report’s own language: a restated forecast is a total, and “add new load” is an addition. Committed sibling delivery points from the same cycle are stacked into the change case.
Where the remaining error comes from. The two largest residuals trace to loads present in SPP’s internal cases but not enumerated in any public document. They mark the reproduction floor available from public data rather than a limit of the method. The flow-convention rule was validated separately against 183 rows of SPP’s own DocuCheck workbook.
What this means for a large load project
A delivery point can be screened before the utility study comes back. For a data center campus that means site selection and sizing can proceed against a defensible estimate of what the network will carry, rather than waiting on a study cycle to find out.