Reproducing the CAISO deliverability modelling
Methodology, RAS, and validation for Cluster 14 Phase II, PG&E region.
Why this study
Deliverability determines cluster entry, Full or Partial Capacity Deliverability Status, and therefore Resource Adequacy contracts. CAISO publishes the Cluster 14 Phase II results in full, which makes them usable as an answer key. We rebuilt the PG&E region assessment using only inputs available before CAISO published, then graded our output against the printed result.
Results
CAISO’s C14 Phase II Appendix I publishes 24 Area Deliverability Network Upgrades mitigating 24 area constraints in the PG&E region. The simulation identifies all 24, and every published loading is reproduced within 10 percentage points.
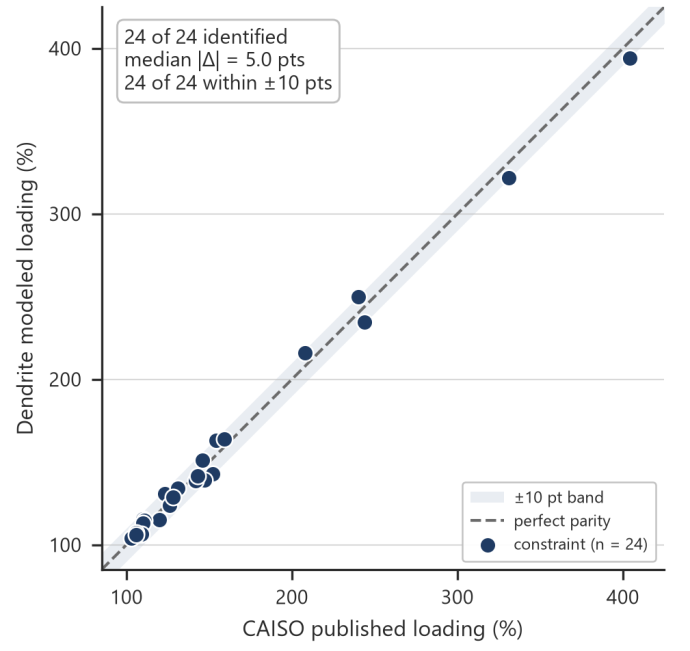
Remaining deviation traces to three sources: CAISO’s engineering-judgment choice of which monitored and contingency pair represents an area constraint, the dispatch assumptions embedded in the prepared base cases, and differences between the vintage of the case data and the tables as published.
Remedial Action Schemes
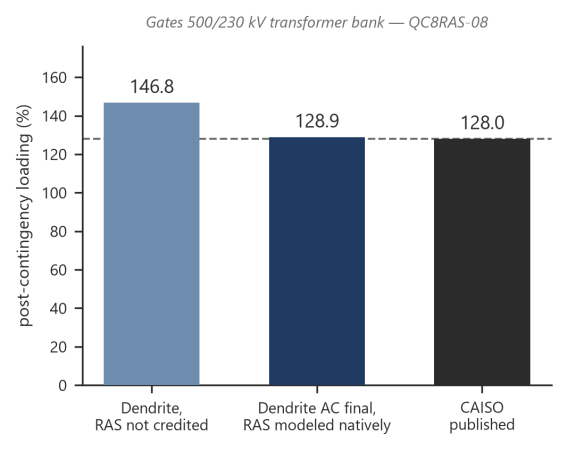
CAISO’s assessment credits RAS operation, but the armed contingency definitions and RAS files are not part of the publicly available data. We built our own RAS database, assembled from CAISO and WECC reports, policy documents, legal filings and powerflow cases, and model the schemes natively.
Method
- Case preparation. CAISO’s master deliverability base cases split by region per the typical CAISO region split, regional C14 generators dispatched at 80% of Pmax, and injection groups constructed for RampGens, SinkGens and ClusterGens, following the On-peak TPD Deliverability Methodology.
- DFAX circle. Responsible generators for each monitored element aggregated by distribution factor threshold, with a flow-impact test on generation capacity per the CAISO methodology.
- Ranking and ramp. Generators ranked by distribution factor against available headroom, worst harmers ramped to their limit under a worst-case injection cap, and the Facility Loading Adder applied.
- Grouping. Overloads consolidated into Area Deliverability Constraints, with one representative monitored and contingency pair selected per constraint.
- AC verification. A full AC powerflow solve performed for every DC overload.
- Automation. Scripted end to end from case files to deliverability results, with queue and transmission-upgrade assumptions swappable by market, region and point of interconnection.
What this means for a project. TPD exposure at a point of interconnection can be estimated before CAISO publishes it. Because the screen retains the harmer ranking behind every overload, constraint drivers stay traceable to individual projects rather than arriving as an unexplained number.
Further application
The same pipeline applies to the Cluster 16 point-of-interconnection deliverability map, the 2027 TPD allocation process, and future Interim Deliverability Allocations where Net Qualifying Capacity is determined.